| Table of contents |
In contrast to storage, visualisation will print certain aspects of the corresponding data, e.g. block structure of a block cluster tree or the block wise rank in case of 𝓗-matrices. 𝓗𝖫𝖨𝖡𝗉𝗋𝗈 uses PostScript and VRML for visualisation, albeit the latter is mainly used for 3D objects, e.g. BEM grids.
Coordinate Visualisation
Coordinate sets can be visualised in PostScript, VRML or VTK file format, implemented in TPSCoordVis, TVRMLCoordVis and TVTKCoordVis respectively. Each of these visualisation classes provide the basic function
for printing the coordinates to file filename. Furthermore, the various classes also provide special function to visualise clusters or block clusters using the coordinate information in coord.
Cluster Tree Visualisation
Matrix Visualisation
Matrix visualisation in 𝓗𝖫𝖨𝖡𝗉𝗋𝗈 is solely implemented in TPSMatrixVis, e.g. in PostScript format. The output can be changed via several options to show different aspects of the matrix, e.g. the block structure, non-zero pattern, local ranks or singular value distribution. The basic output function of TPSMatrixVis is
which will print the matrix A into the file filename.
Options are also set via functions, where for most functions the only argument is of boolean type and either turns the corresponding feature on or off:
| Function | Description |
|---|---|
structure(b) | Print the block structure of the matrix. This is the default setting. |
nonempty(b) | Only print nonempty blocks. |
entries(b) | Print matrix coefficients |
pattern(b) | Print sparsity pattern of matrix. |
sparse_pattern(b) | Print sparsity pattern of matrix only for blocks of type TSparseMatrix. |
svd(b) | Print singular values for each low-rank and dense block of the matrix. |
svd_ref(max,min) | Define scaling interval for block-wise singular values, e.g. maximal and miminal values are assumed to be max and min. If max/min ≤ 0, the largest and smallest local singular values per block are used instead. A good choice for max is |
rank_col(b) | Colour the low-rank blocks according to local rank vs. full rank. |
max_size_ratio(r) | Set maximal allowed ratio of local block size (no. of rows or columns) compared to matrix size, e.g. block with a larger ratio (and hence, smaller size), will not be printed (for very large matrices this limits file size). |
 . min can be ommited in which case the machine precision is used.
 The option functions can also be concatenated:
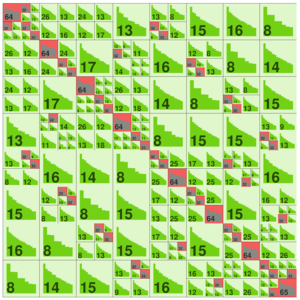
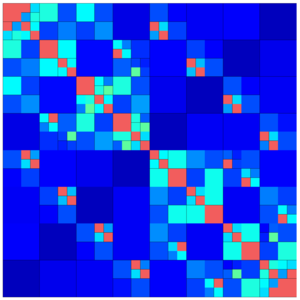
The following images show different output settings of the same matrix:
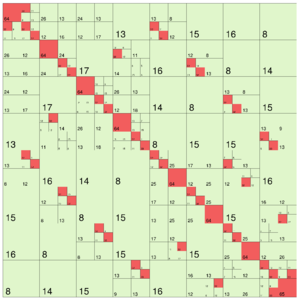
| 
| 
|
default output (structure = true) | svd = true | rankcol = true, structure = false |
Here, each type of matrix block is printed with a distinct colour (assuming rank_col = false):
- : NULL or empty blocks (on case of
nonempty= true) - : dense
- : low-rank
- : uniform
- : sparse
Grid Visualisation
Grids may be printed in either PostScript, VRML or VTK format, implemented in TPSGridVis, TVRMLGridVis and TVTKGridVis respectively. Each of these visualisation classes provide the basic function
to print the given grid to a file. Beside this, it is also possible to print a given grid function defined by a real, scalar vector over a function space using:
The function is here drawn using a colour map corresponding to the function values at the triangle points.